June 2023 Market Summary
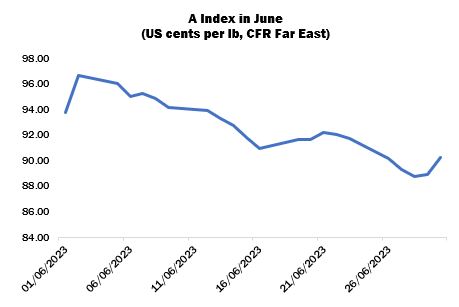
International cotton prices as measured by the Cotlook A Index displayed a distinct declining trend throughout June. Merchants continued to struggle to place cotton with spinners in a landscape characterised by low demand from every market except China, while buyers in that quarter were still extremely price conscious and securing business was often possible at the cost of further reductions in terms of basis. The A Index reached a high point of 96.65 cents per lb on June 2, and achieved its lowest position for seven months towards the end of the period: 88.70 cents per lb on June 28.
Yet again, however, there was little sign of any improvement in the margins generated on sales of yarn in the major consuming countries, since garment and textiles orders from the US and especially Europe were understood to be lower than usual for the time of year, with smaller quantities booked, short turnaround times and frequent reductions or cancellations by retailers and brands. Spinning activity was acknowledged to be slow especially in Bangladesh, Pakistan and Turkey, as each country continued to battle against its economic problems.
On the other hand, the mood was definitely a little brighter in China. US export sales of upland cotton in the four weeks between June 2 and 29 amounted to 919,000 bales, of which 58 percent was destined for China. Shipments in the review month totalled 967,000 (20 percent for China).
The marked increase in business in China coincided with a significant readjustment in the relationship between the prices for domestic cotton and international growths. The price advantage for local supplies had been shrinking since early February, and two measures –the China Cotton Index and the A Index adjusted to comparable terms – achieved parity towards the end of April, thereafter tending to favour imports in terms of competitiveness. In June, the discount for international supplies grew from 240 yuan per tonne to around 2,000 yuan (over 12 percent) towards the end of the month.
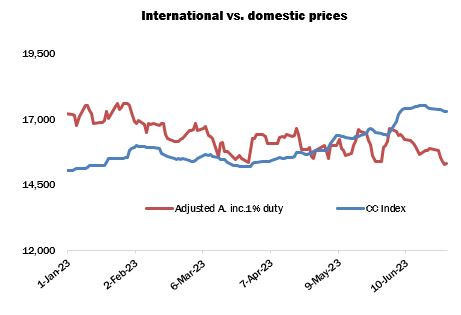
As illustrated in marked fashion in the accompanying chart, the realignment of the price relationship owes just as much to the rise in offering rates within China as it does to the lowering of international merchants’ asking prices in recent months. The bullish energy seen in June was inspired by a perception that stocks by end of August may be tighter than previously expected. Moreover, the new crop itself will in all likelihood represent a substantial reduction from the results achieved in 2022/23. In combination, these factors served to generate a sharp increase in values on the ZCE cotton futures platform in early June that was then reflected in physical cotton prices. It seems that several traders including some state-owned enterprises took the opportunity to enter the market and book additional lots from various origins – the US in particular, but Brazil and Australia too – from both the current and coming crops. The participation of the State Reserve amongst the buyers of US cotton was strongly suspected in many quarters. Mills, however, remained largely on the sidelines, tending to cover any short-term needs with lots held on consignment.
In our June review of global supply and demand, the estimates for production in both 2022/23 and the season ahead were subject to not insubstantial increases. In the current season, additional positive news from the Southern Hemisphere prompted a further upgrade to the forecast for Australian and Brazilian production (both of which appeared set to approach – or even surpass – their highest ever totals). An addition was made for Afghanistan, where cotton seems to have been one of the beneficiaries of an official policy to move away from opium poppy cultivation. For 2023/24, the estimate for China was reduced in light of the smaller area achieved by the end of the planting campaign and the somewhat unfavourable weather during the sowing period (though conditions seem to have improved in the period since). However, adjustments elsewhere all represented additions to the balance sheet, in particular Pakistan and the US. In total, the increases in the estimates of production amounted to 290,000 tonnes for 2022/23 and 690,000 tonnes for the season ahead.
The improved prospects for consumption in China (one of the only major global economies to have escaped the sharp rise in inflation seen elsewhere) accounted for almost all of the month’s adjustments to that side of the balance sheet. The addition for 2022/23 was only partially offset by a modest reduction for the US.
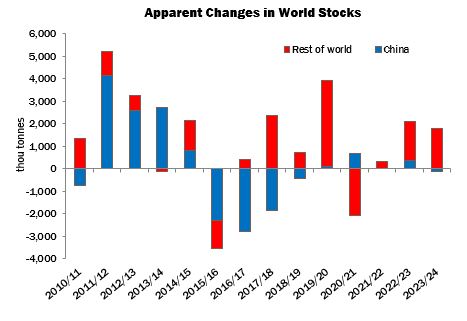
Thus, the forecast increase in global stocks expanded for both the current and next marketing years. The rise for 2022/23 was estimated at 2.04 million tonnes (up from 1.98 million in May), while for 2023/24 it was 1.68 million (1.13 million a month earlier).