July 2021 Market Summary
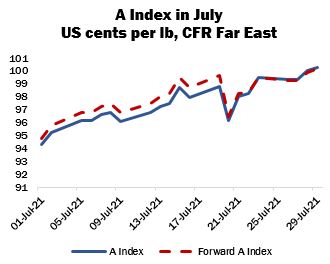 The end of July marked the transition from one marketing year to the next, and with it the disappearance of the 2020/21 Cotlook A Index. World prices maintained an upward trajectory for most of the season, retreating briefly on only two occasions in the first and second quarters of 2021 before resuming their advance. The Cotlook A Index began the season at its low point of 69.55 US cents per lb and has ended the period at 100.25, the first time the A Index has exceeded the dollar mark since mid-June 2018. Historically, a dollar Index has been a rare occurrence. The seasonal average for 2020/21 was slightly below 85 US cents per lb.
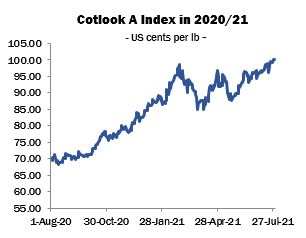
The 2021/22 Index (until August 1 referred to as the Forward Index), representing cotton for shipment no earlier than October, will stand alone until early in 2022, when a 2022/23 Forward Index will be established, as soon as sufficient market evidence is available.
Underlying demand was evident during July, despite rising asking rates, and mills in many countries remained in need of cover for the summer months. Spinners tended to focus mainly on supplies to meet their more pressing requirements, availability of which became increasingly tight. The now well-attested freight issues continued to blight deliveries and many international merchants appeared to have little cotton to ship ahead of the arrival of Northern Hemisphere new crops. Even the Brazilian crop, usually relied upon to bridge the gap between seasons, is well committed both from origin and (for earlier shipments) from trade holdings. Little selling pressure is evident on the part of growers, thus merchants have found it difficult to replenish their positions.
In China, State Reserve auctions began at the beginning of the month to robust demand: all daily catalogues offered during July sold out, to a total of over 190,000 tonnes (almost a third of the total volume to be offered in this year’s series). A small portion of transactions involved Xinjiang cotton produced in the 2019/20 season, which began to appear in sales figures mid-month, despite earlier indications that only 2012/13 and 2013/14 cotton would be included in the auction series. Between December 2019 and March 2020, the Reserve acquired some 371,000 tonnes of Xinjang 2019/20 crop.
The assumption remains in some circles that Chinese authorities will sanction import buying to replace the stocks disposed at auction, under the ‘rotation’ principle that has heretofore informed State Reserve policy. However, the timing of any entry into the international market, and the origins likely to be targeted, owing to the lack of nearby supply and the self-imposed deadline of end of February arrival, remain imponderables to the international trade.
The process of allocating Sliding-Scale import quotas to mills (from the 700,000 tonnes announced at the end of April) finally began in mid-July, but a notable upturn in demand from Chinese buyers for shipment cotton has so far failed to emerge. Spinners in receipt of quota turned predominantly to stocks held at ports, ostensibly owing to a price advantage, as well as the ease of delivery compared with shipment cotton, which has been subject to the above-mentioned delays.
That lack of activity was reflected in reports of US export sales during July: by the week ended July 22, China accounted for just eight percent of all upland sales for shipment in 2021/22, versus around 31 percent of upland sales and shipments in 2020/21. Total upland sales commitments for 2021/22 stood by late July at roughly 3.16 million running bales, the lowest forward commitment since 2016.
In Cotlook’s July estimate of global production, more than half a million tonnes have been added to our figure for the 2021/22 season. The major upward adjustment was made to the figure for the United States, where ample rainfall in recent months has increased expectations of yield and lowered prospective abandonment in the important West Texas growing region. Cotlook’s figure, although subject to revision as the hurricane season progresses, currently stands at just over 3.9 million tonnes, versus less than 3.6 million at the end of June.
The other noteworthy change was to Australian production: optimism has persisted with regard to the 2021/22 crop, owing to receipt of very good rainfall which has replenished reservoirs and will allow farmers to plant cotton on a greater scale than in recent years. Our figure has been increased to one million tonnes, a level not seen since the 2017/18 season.
The revised global number is now slightly over 25.8 million tonnes, representing an increase of seven percent from our estimate for 2020/21, which was also raised modestly in July. Output in 2021/22 is therefore expected to recover to roughly the same volume that was produced in 2019/20.
World consumption, meanwhile, was raised by 100,000 tonnes, resulting from a 50,000 tonne increase each for Bangladesh and Turkey. Those countries appear to have benefited from the recovery of consumer spending on western markets and favourable trading conditions in cotton yarn that have emerged in recent months. Global consumption is therefore placed at over 26 million tonnes, a threshold that was last exceeded in 2017/18.
As a result of the above changes, world stock levels by the end of the 2021/22 season are expected to have fallen by 241,000 tonnes, down from 661,000 a month ago, with a decline in China more than offsetting an almost negligible increase in the rest of the world.