February 2021 Market Summary
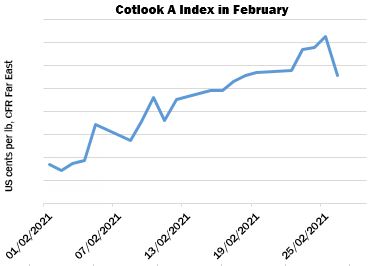
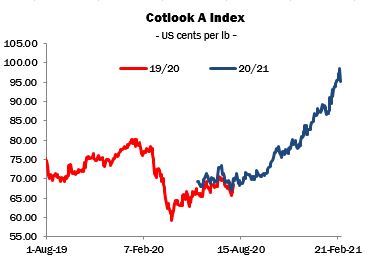
February saw the continued advance of world prices from their nadir in early April 2020, when the impact of the Covid pandemic on the cotton textile supply chain was at its most severe. Since then, the recovery has proceeded more or less unchecked. The Cotlook A Index rose in tandem with New York futures for most of February and looked poised to reach the psychologically important dollar mark around the end of the month. Since it was created in the 1960s, a ‘dollar Index’ has been an infrequent occurrence and rarely sustained for long. In the event, a sudden sell-off in New York (mirrored in other financial markets) provoked a sharp but partial correction. At the end of February, the Index stood at 95.10 cents per lb, having made a net gain of 8.50 cents, almost ten percent.
For most of the period, cotton futures shared in the buoyancy exhibited by other commodity futures and equity markets. Financial stimuli and the economic optimism engendered by the progress of vaccination programmes have contributed to a rising tide that lifted the value of all assets. The Dow Jones Industrial Average recorded an all-time high on February 24, the day before the sharp downward correction alluded to above.
Cotton prices also derived strength from supply and demand fundamentals and in particular from a tightening United States balance sheet (only US cotton can of course be delivered against the New York cotton futures contract). Despite escalating prices, the pace of US export sales remained robust during the month.
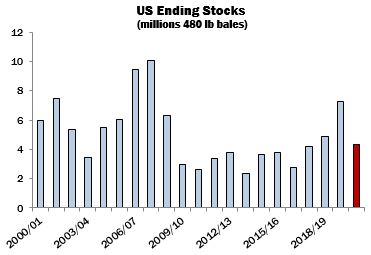
In its February supply and demand estimates, the United States Department of Agriculture raised its forecast of exports during the 2020/21 season by 250,0000 bales (480 lbs) to 15.5 million. As a result, the projected ending stock was reduced to 4.3 million bales – versus a beginning stock of 7.25 million. Most trade observers predict that this season’s carryover will prove to be well below four million bales, given that export commitments were within about seven percent of the Department’s forecast by mid-February and that shipments were also fairly strong. In addition, based on ginning and classing data, a further reduction in the production forecast is anticipated in March. The 2021/22 marketing year should therefore commence with a much-reduced beginning stock, a prospect that has contributed to a generally bullish outlook for the season ahead.
One consequence of the relentless rise of futures during February was to prompt a flurry of trading activity in Indian cotton. For some time, offers from that origin had gained rather less traction in export markets than might have been anticipated, given its relative cheapness vis-à-vis other origins. Some spinners have become more accustomed to machine-picked cotton in recent years and are wary of Indian on quality grounds. During the second half of February, however, the Cotton Corporation of India disposed of a substantial volume from its 2020/21 holdings to the local and international trade. A good proportion was also sold onwards, principally to buyers in China who were eager to lock in the price advantage on offer.
More generally, mill buying on most raw cotton import markets became more selective as asking prices continued to rise under the lead of New York. Spinners for the most part appear to have been generating good margins on their recent yarn sales but late in the month became more apprehensive of a market reversal that might undermine yarn selling rates.
On February 25, Cotton Outlook published initial forecasts of world production and consumption during the 2021/22 season. As always, these early projections are accompanied by strong caveats, given that sowing of cotton has yet to begin in the Northern Hemisphere and forecasts of consumption concern a period that will not begin for several months.
Production next season is placed at just over 25.2 million tonnes, and consumption at just over 25.5 million, suggesting a second successive season during which a moderate reduction in global stocks will take place.
Given the major reduction of US stocks that will have occurred by the end of the current season, particular attention will be devoted to the outlook for the US crop over the coming months. In New York, December 2021 futures (the key contract as far as new crop prices are concerned) ended February at 84.33 cents per lb, no less than 35 percent above the corresponding settlement (for the December 2020 delivery) a year earlier. However, futures for competing crops show year-on-year gains of a similar magnitude.
In addition to relative prices, a key influence on the eventual size of the US crop will be the scale of abandonment and the dryland yields obtained in the West Texas growing region that accounts for roughly half of US cotton area in a typical season. The period of exceptional wintry weather that brought great hardship to Texas in February also delivered some welcome moisture. However, more will be required over the coming months if the state’s crop is to realise its potential.